First steps
Opening Antares
One you have installed Antares you should have a window similar to this one:
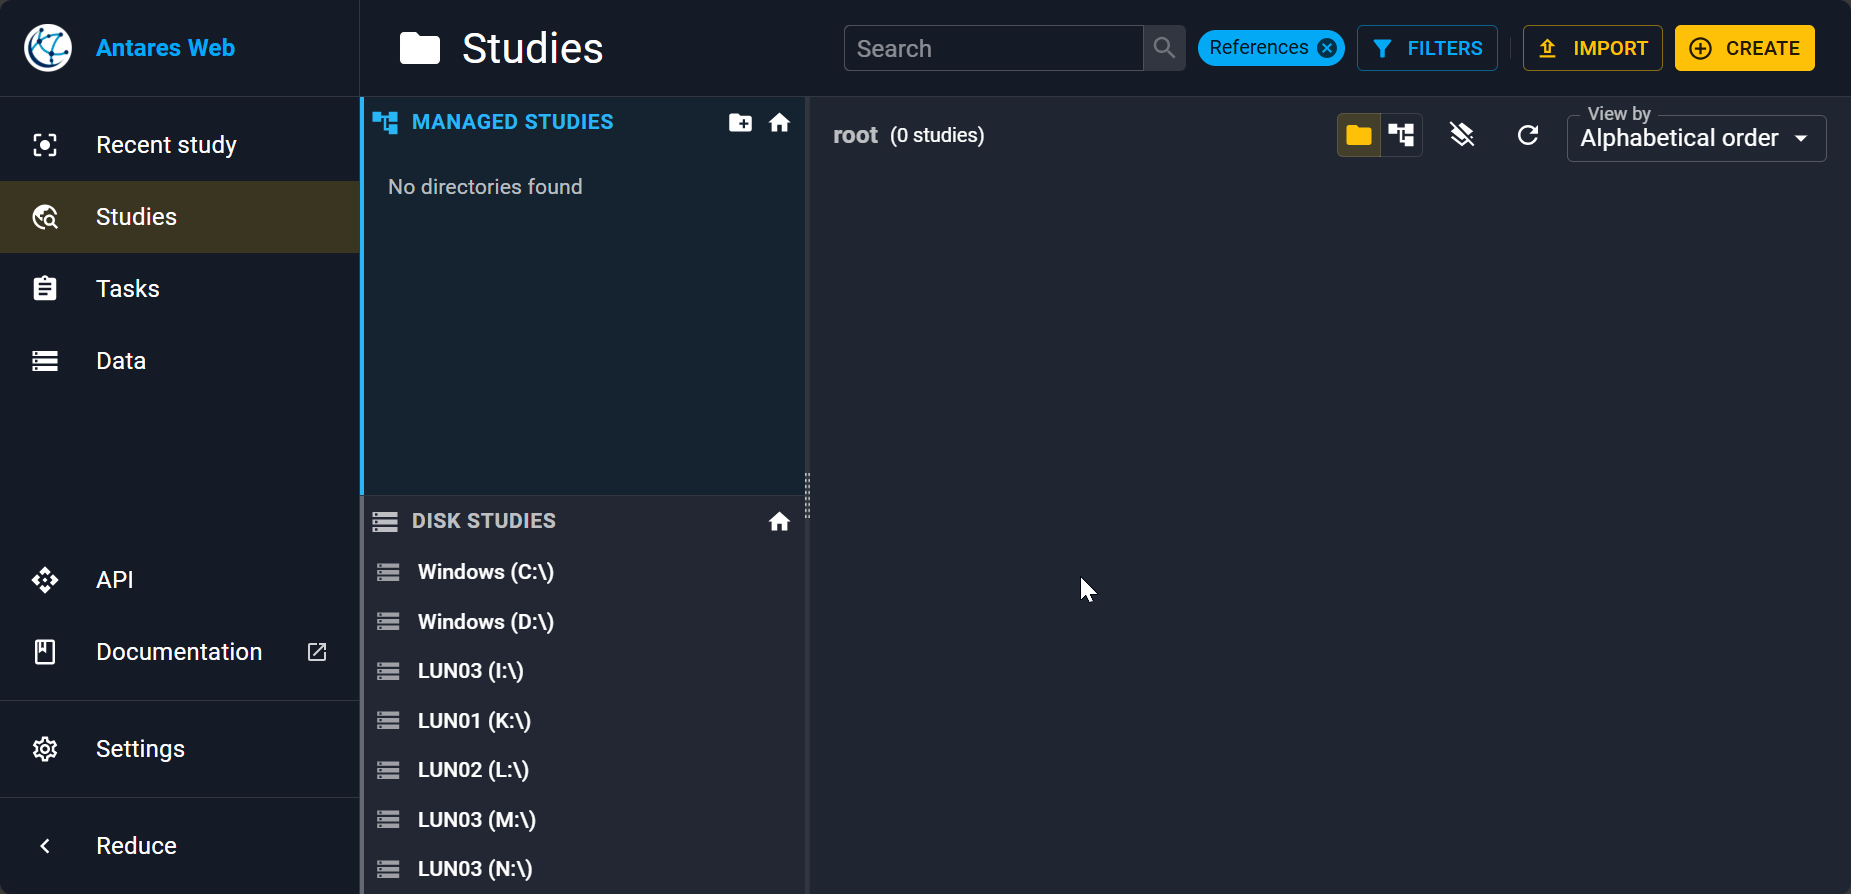
On the left, you have a collapsable sidebar to go to your last study, explore studies, manage simulation tasks, a common data page to mutualise some data accross studies...
By default you will be on the Studies view where you have:
- Managed studies and on disk studies (see the differences here).
- A view of your studies inside the right panel. We are yet to import a study!
Importing a study
As an example, let's import a real world study: the modified 2024 TYNDP study available on zenodo. Once the zip file is downloaded, click the Import button in the top right. Then, drag and drop the zip or click on the pop up to open the file explorer. Importation may take some time.
Note
You can rename your study by clicking on More action and then on Properties.
Study informations
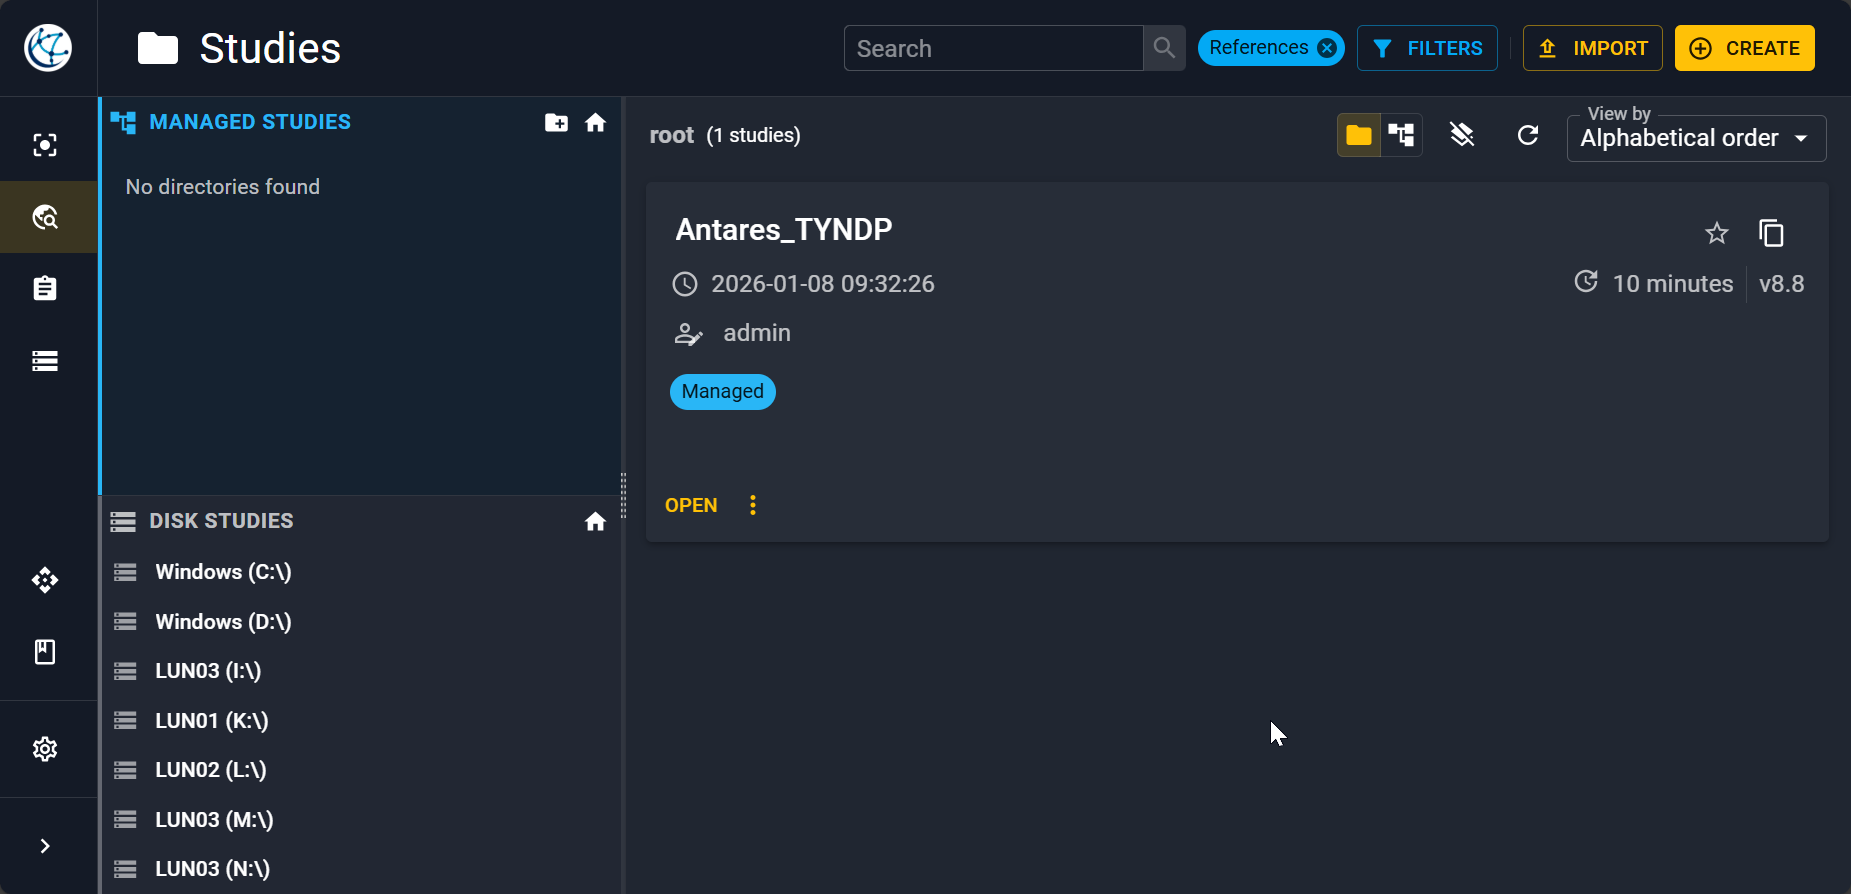
By clicking on the study, you find have a first window with an overview of it.
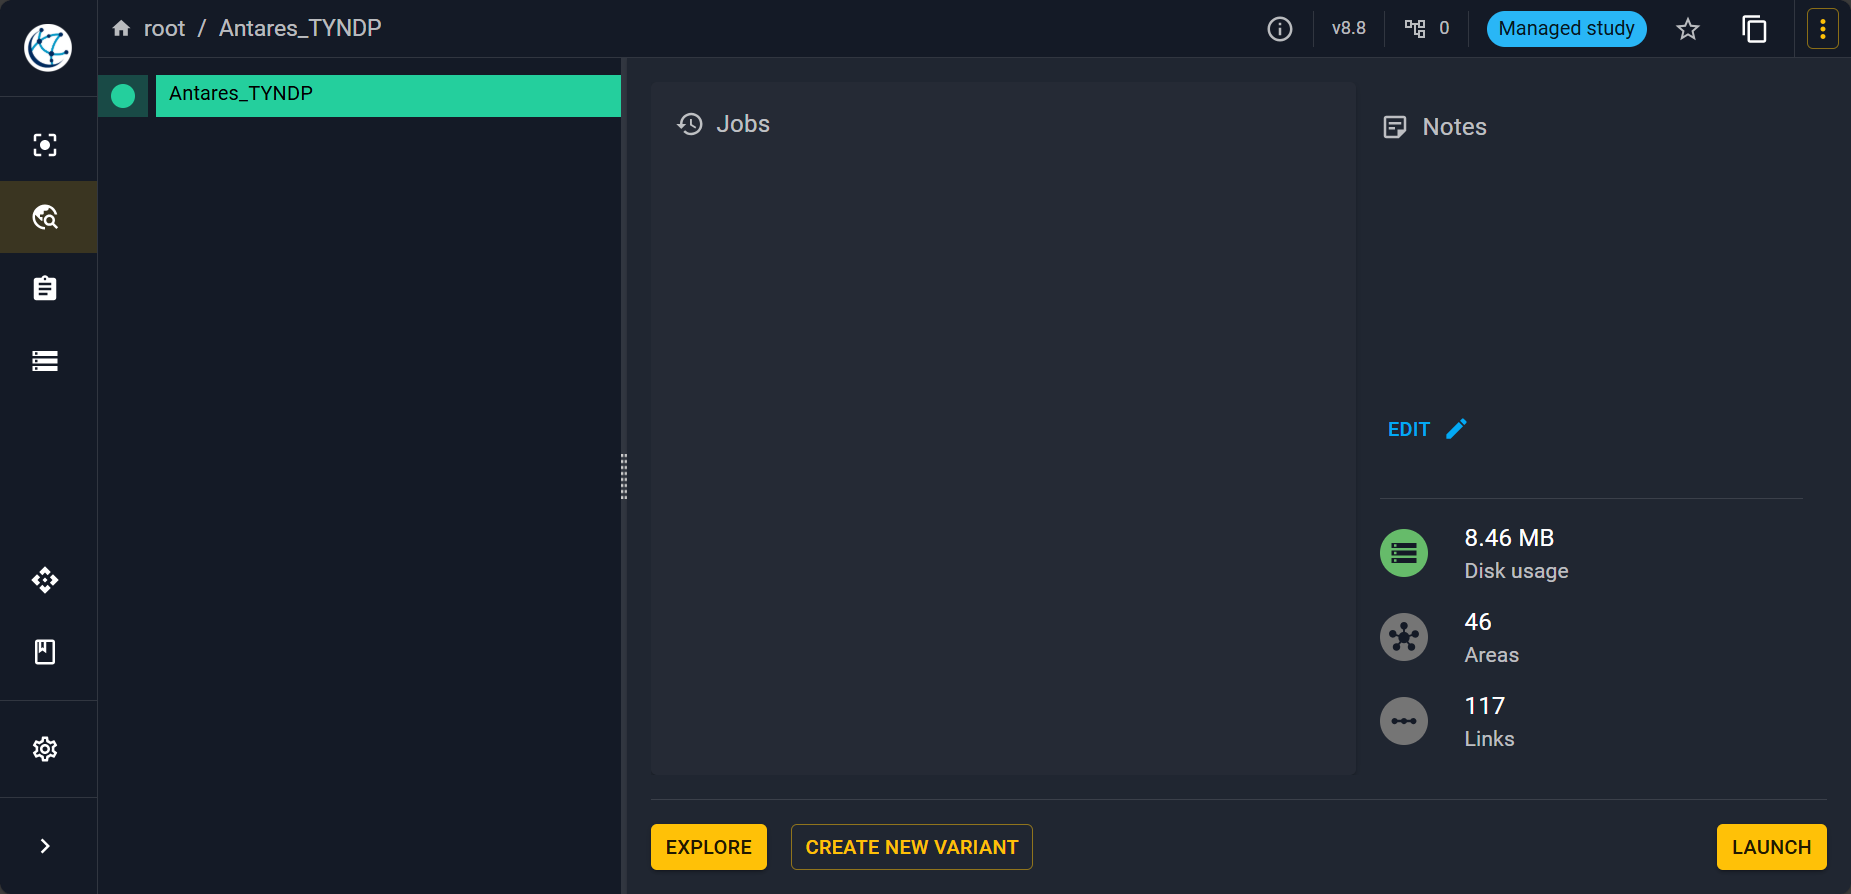
On this view, you can find:
- A study variant tree on the left.
- The list of jobs that is to say the simulations launched.
- Some comments that you can make on the study and some basic information.
Exploring the study
To open the study click on Explore it will open the following view.
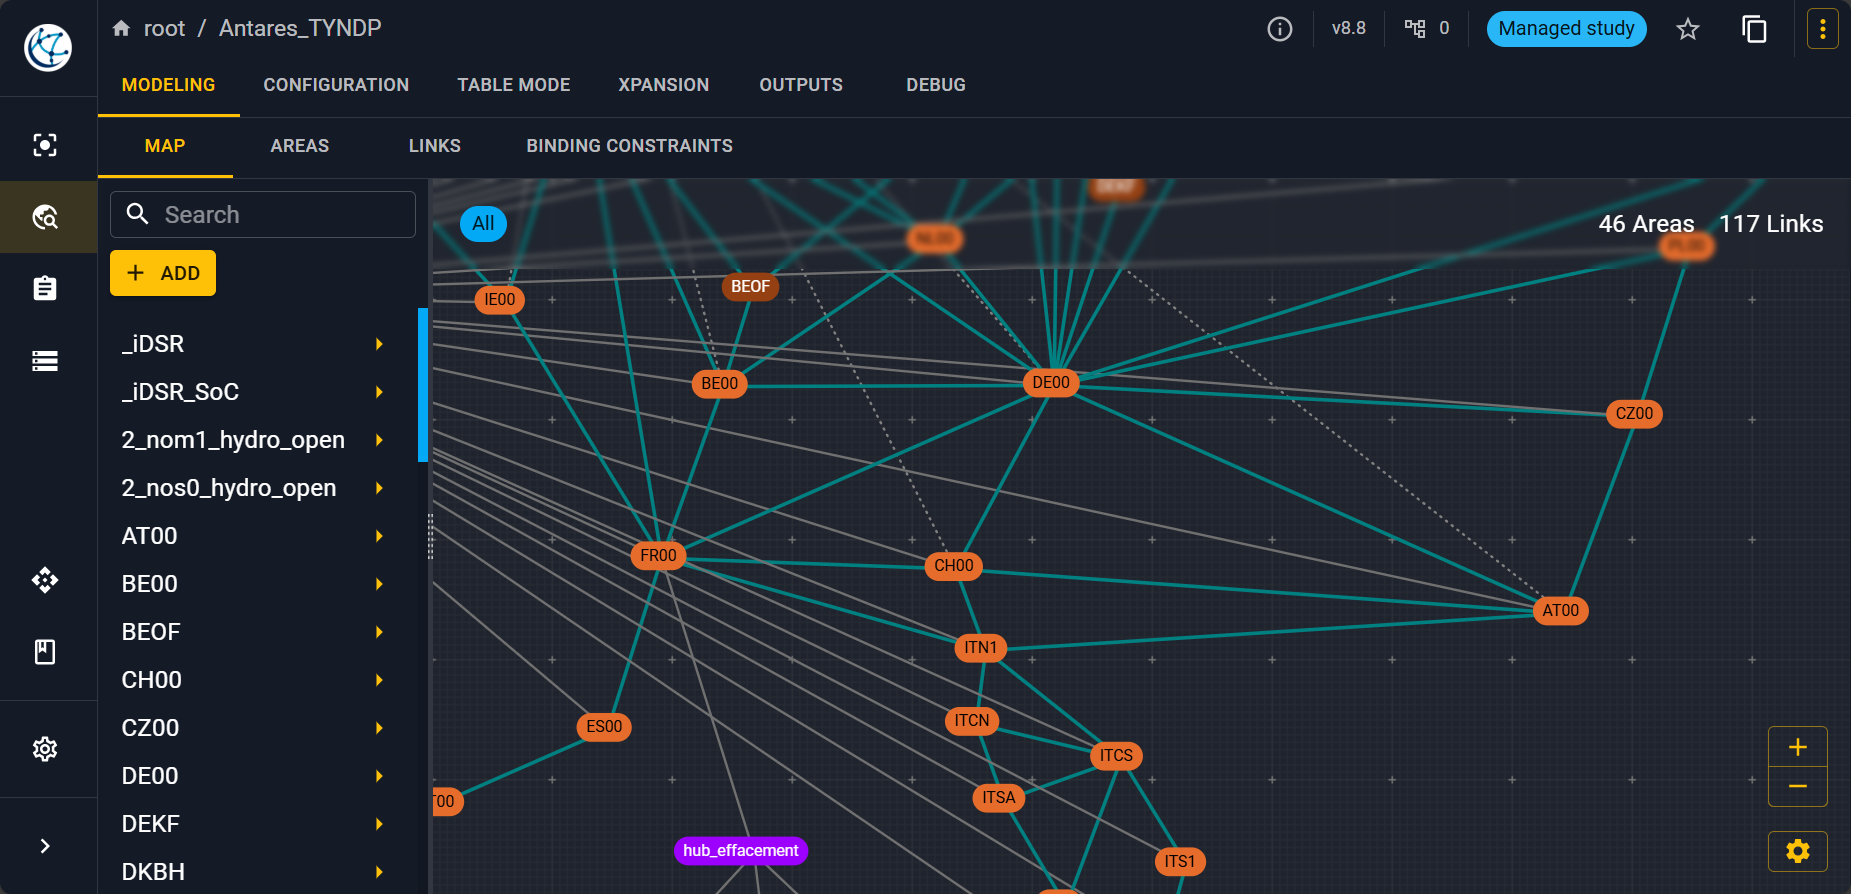
Map
You have first a visualization of the graph of your modellisation with each node corresponding to an area that can be physical or not. Nodes are connected with links. You can view what properties are associated to each area (resp. link) inside the Areas (resp. Links) tab.
Areas
For example here is what you get when you click on Areas and then select the
zone FR00 on the left corresponding to France.
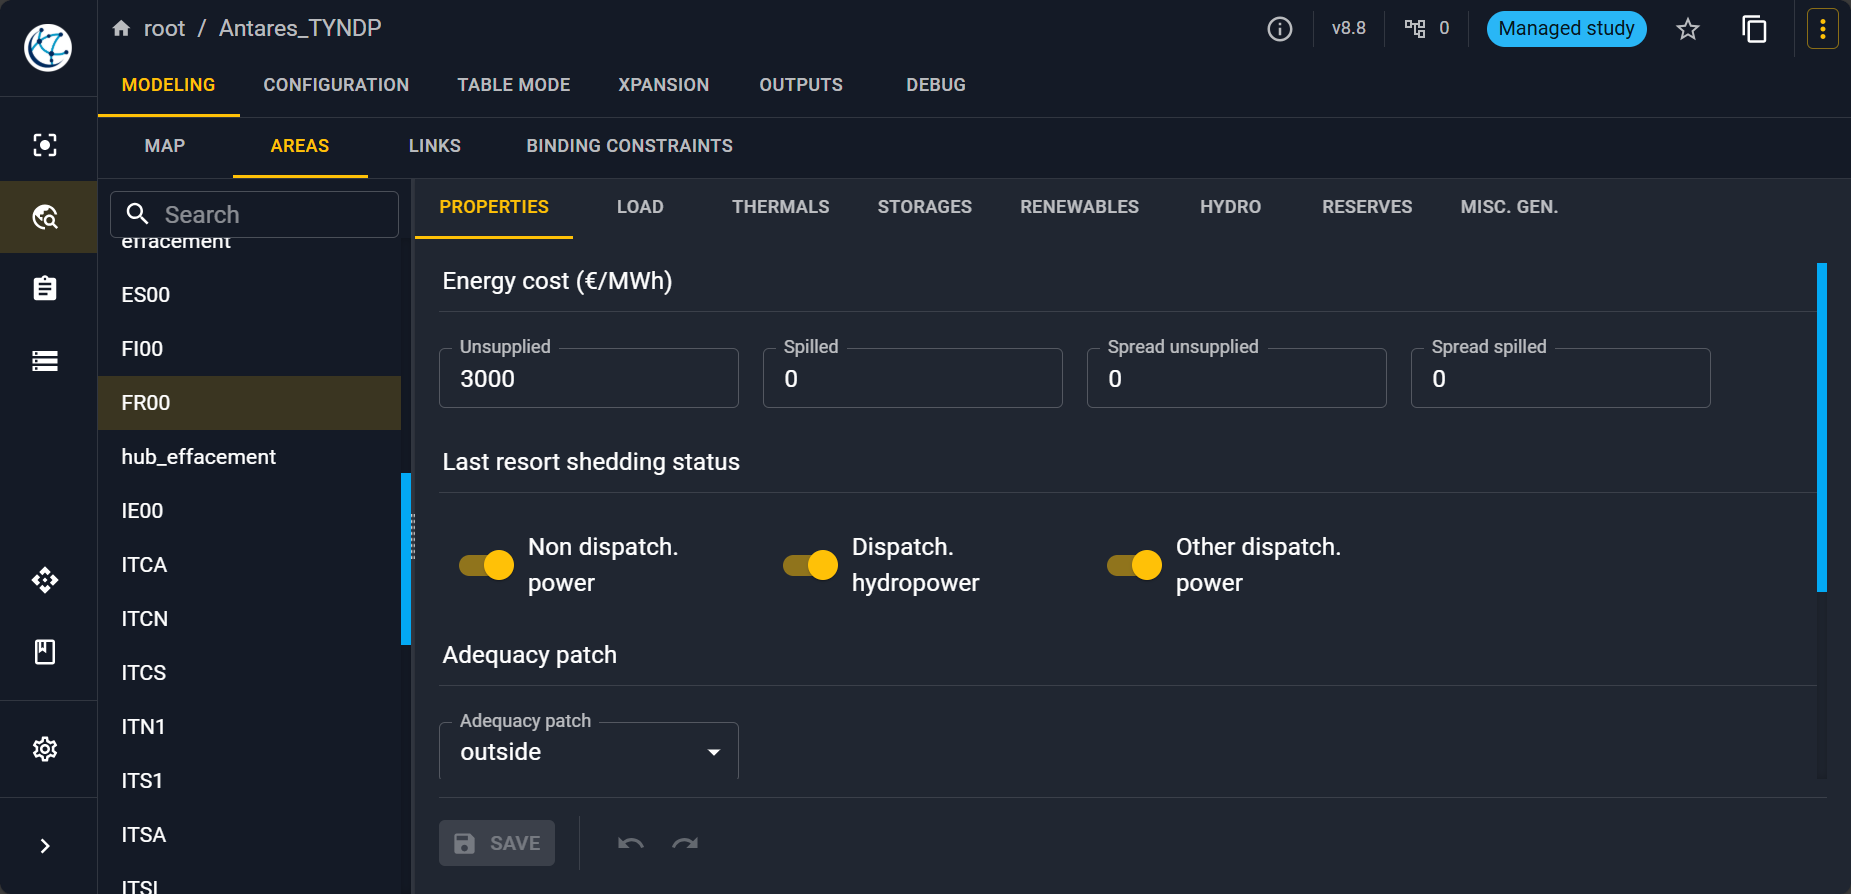
Inside an area, you can define different fundamental object of modelling built in within Antares:
- The electrical consumption of the node in the Load tab.
- Thermal clusters inside the Thermals tab (nuclear, gas, lignite...).
- Some short-term storages inside the Storages tab.
- Renewable clusters (mainly solar and wind production) inside the Renewables tab.
- Some hydraulical generation and long term storages inside the Hydro tab.
- The properties of reserves inside the Reserves tab (primary, strategic...).
- And other miscellanous generation inside the Misc. gen. tab.
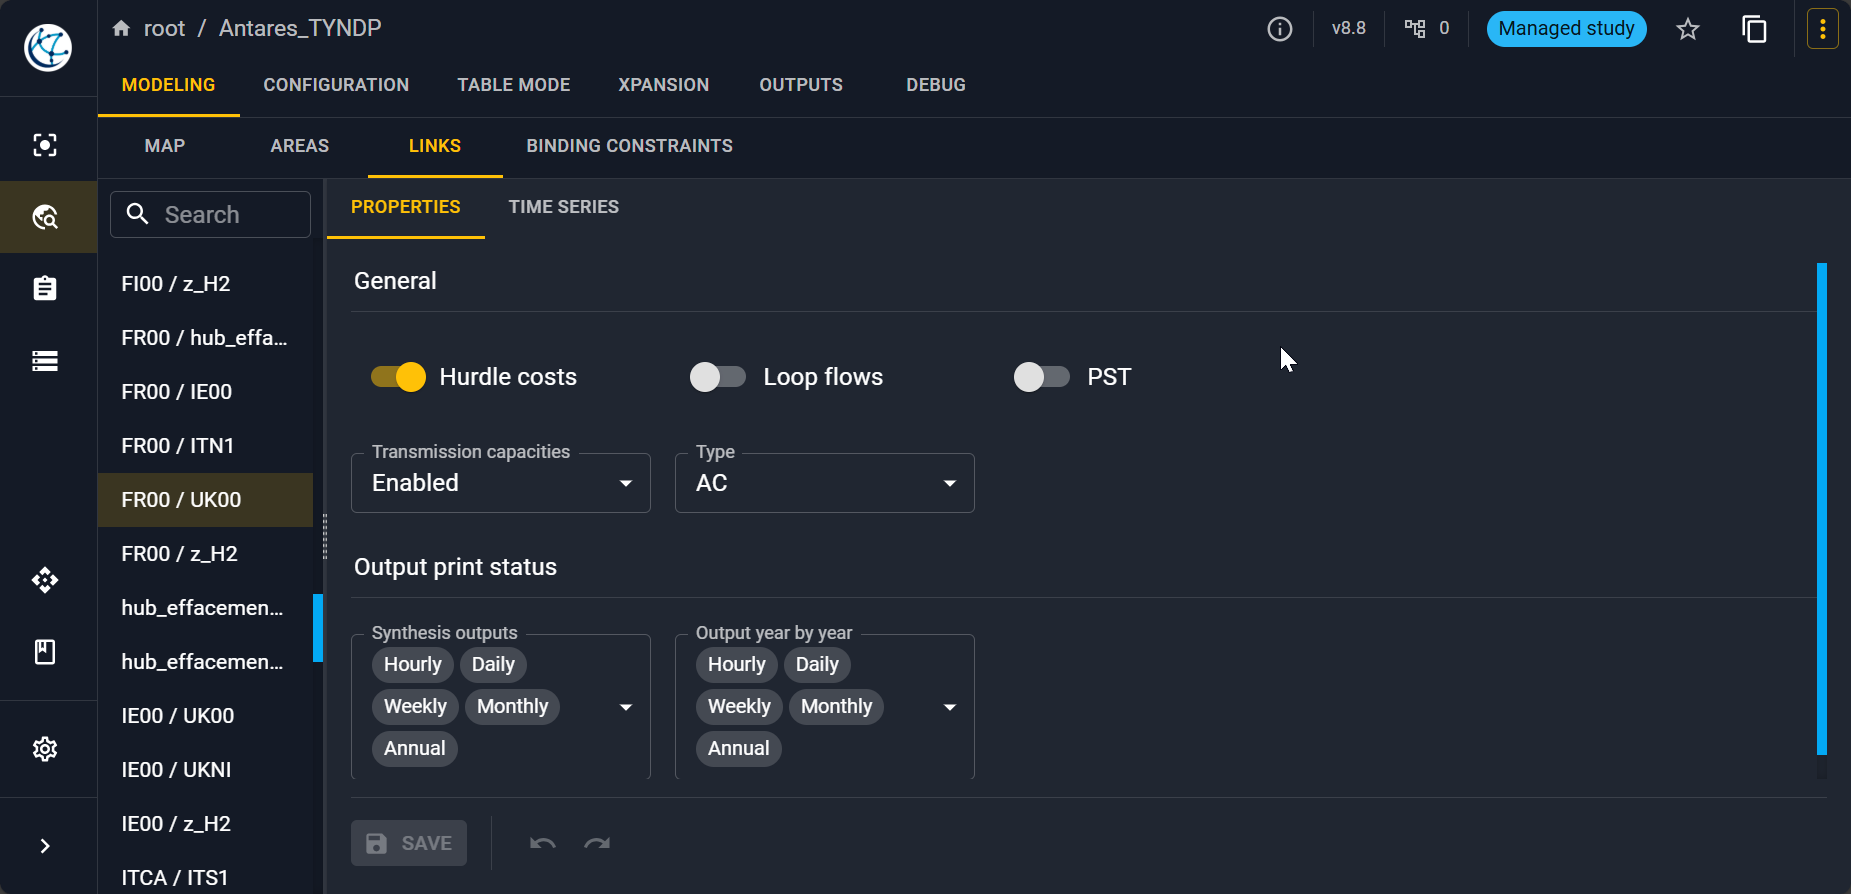
Links
And for the link between France and the United Kingdom.
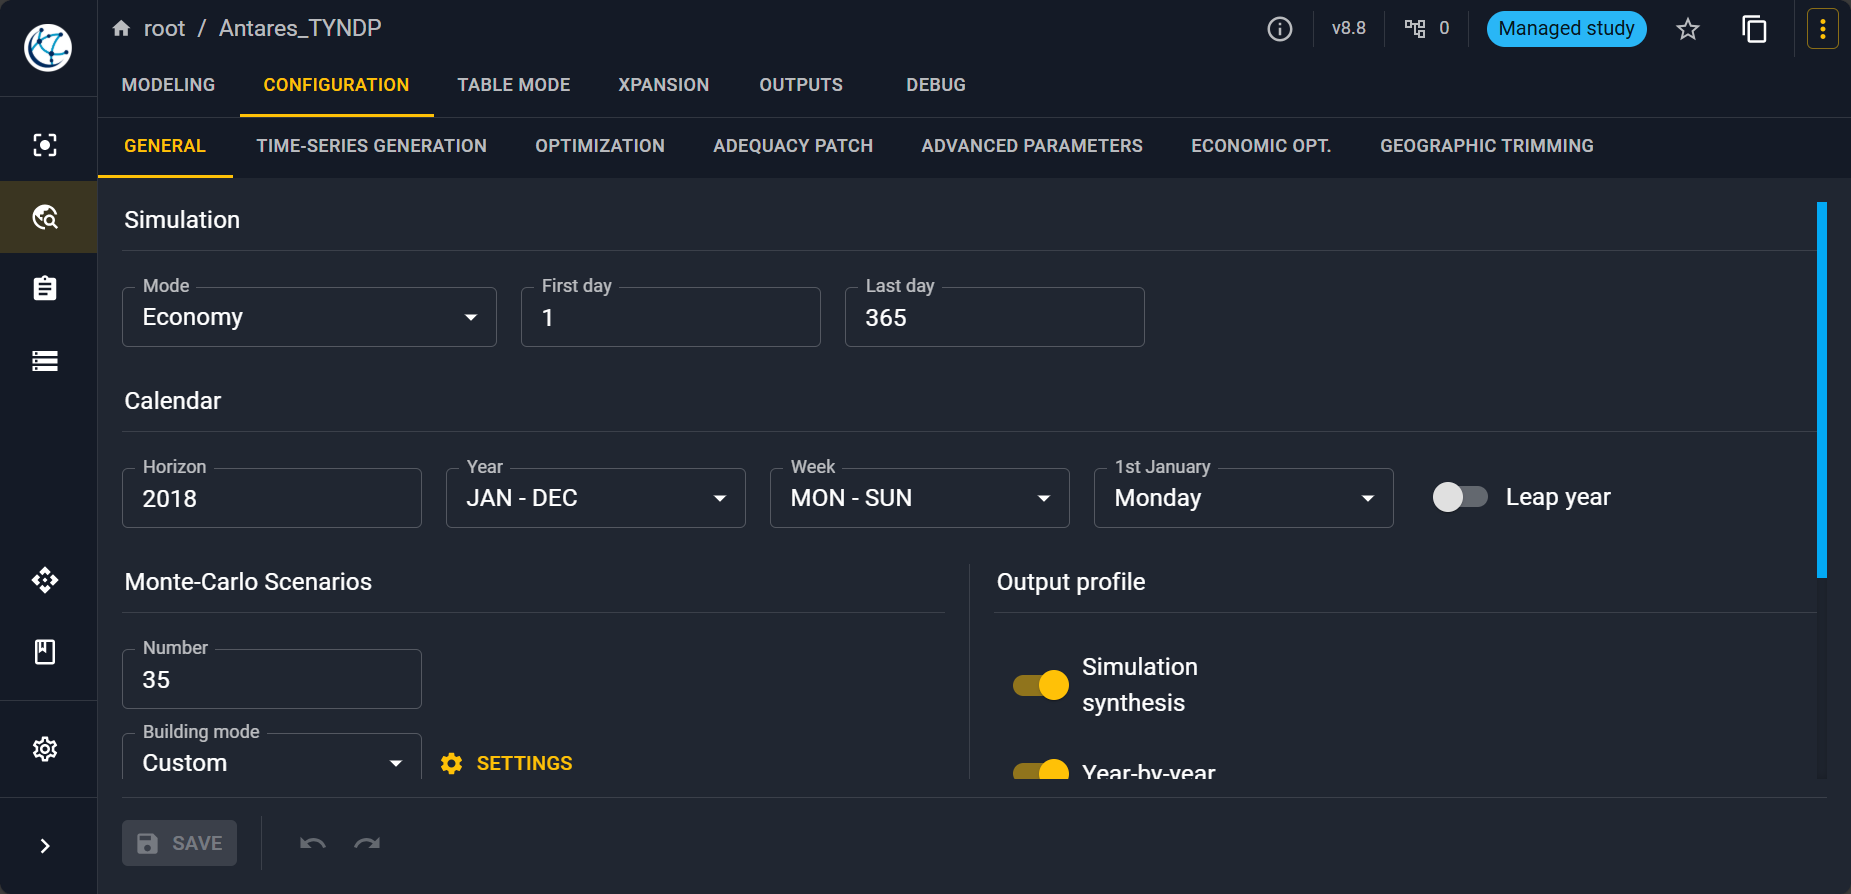
Configuration
In the Configuration tab you have multiple views to select all the parameters that you want to set for the simulation.
Launching a simulation
To launch the simulation, you have to click on the button in the top right and then click on Launch. A pop-up will open:
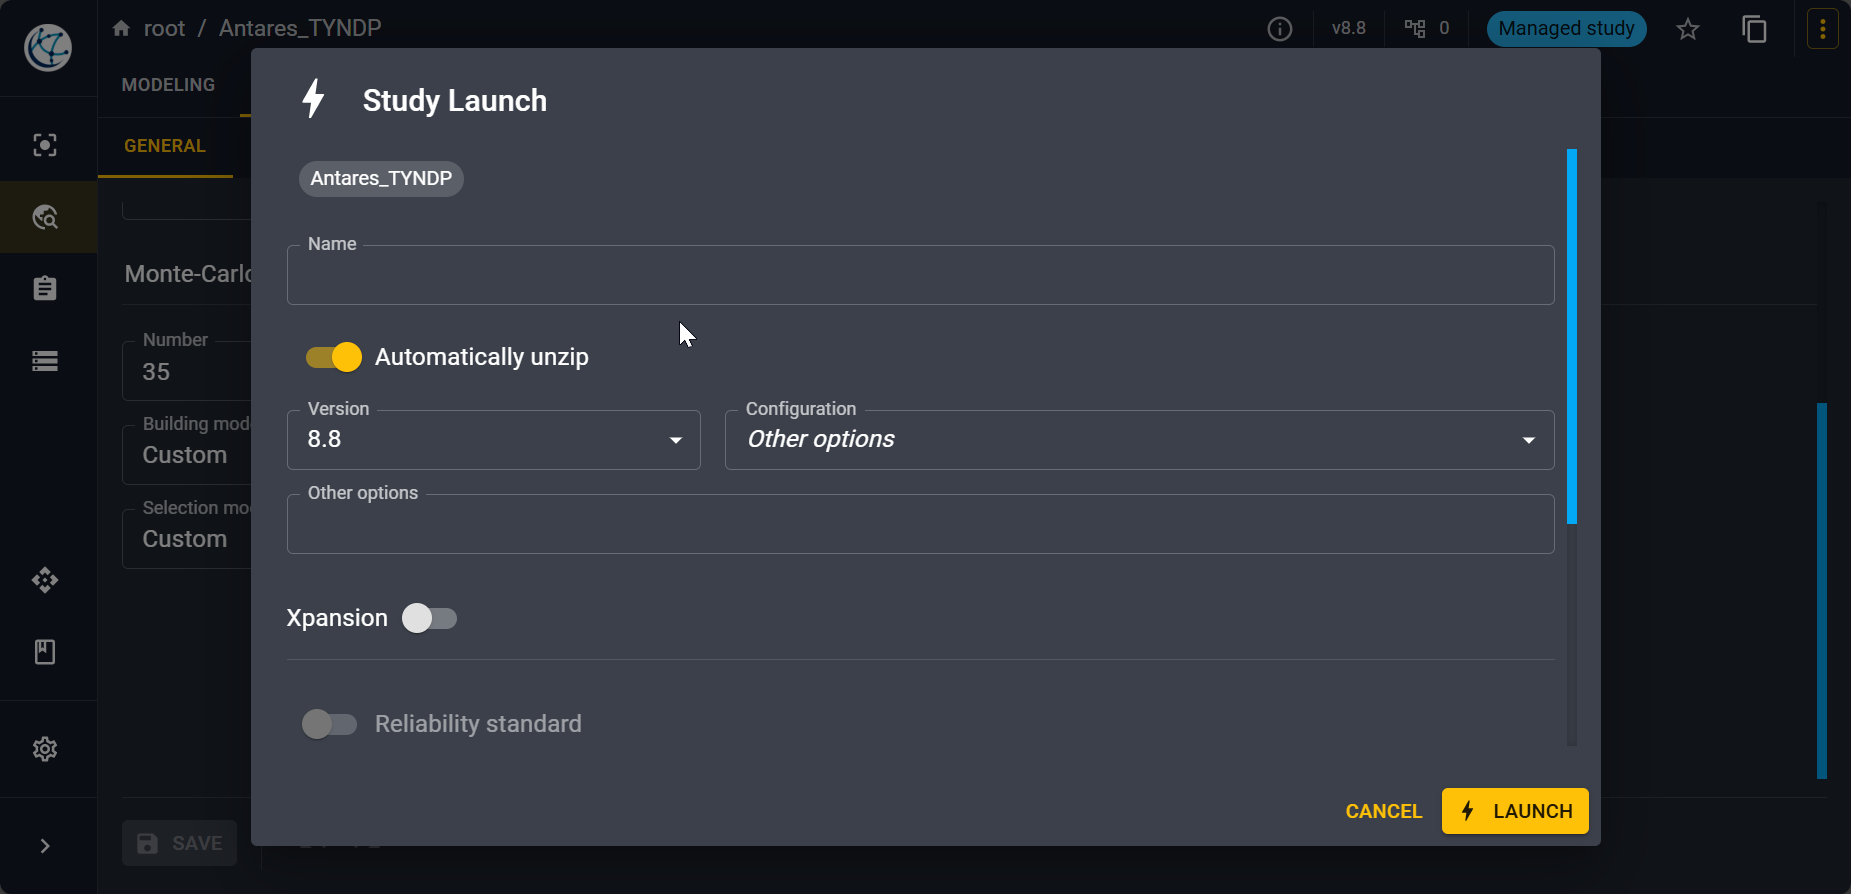
Select the version of the simulator you want to use among those you have on your installation.
Note
You can check the state of your simulation in Tasks view on the side bar.
Outputs of the simulation
Note
On a personal computer equiped with Antares Desktop, an 11th gen intel core i5 and 16 Gb of RAM, the simulation took about 25 minutes.
Data
Once the simulation is finished you can go to the Output tab. You have there the list of all your outputs.
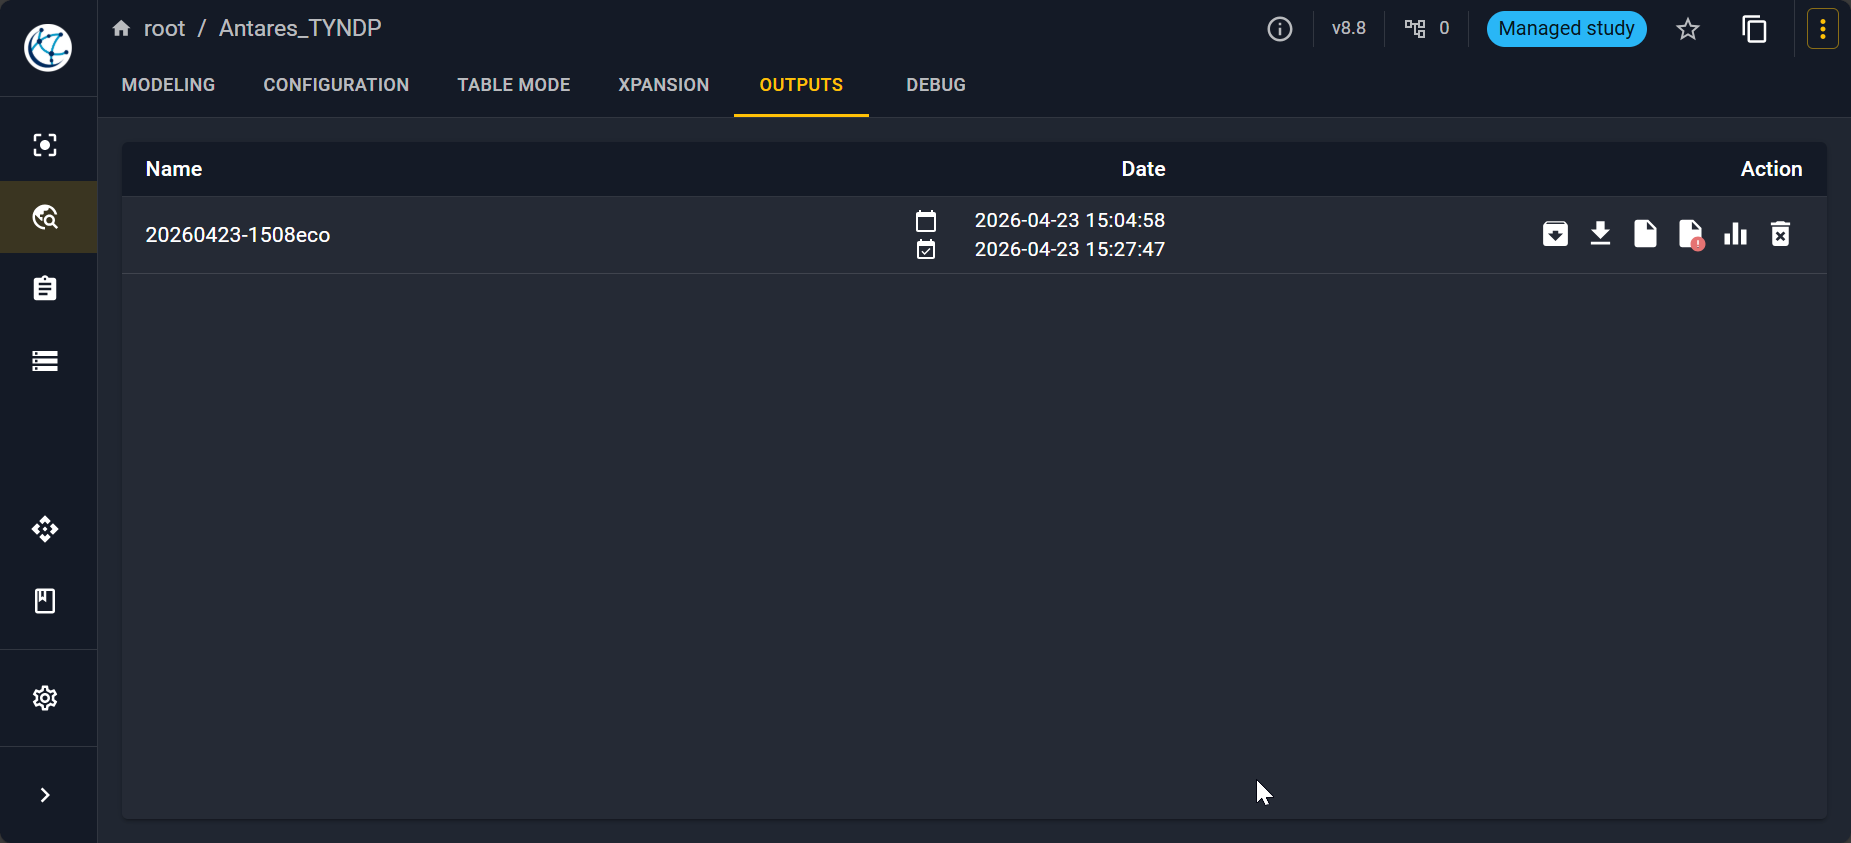
For example for the area corresponding to France you can view results.
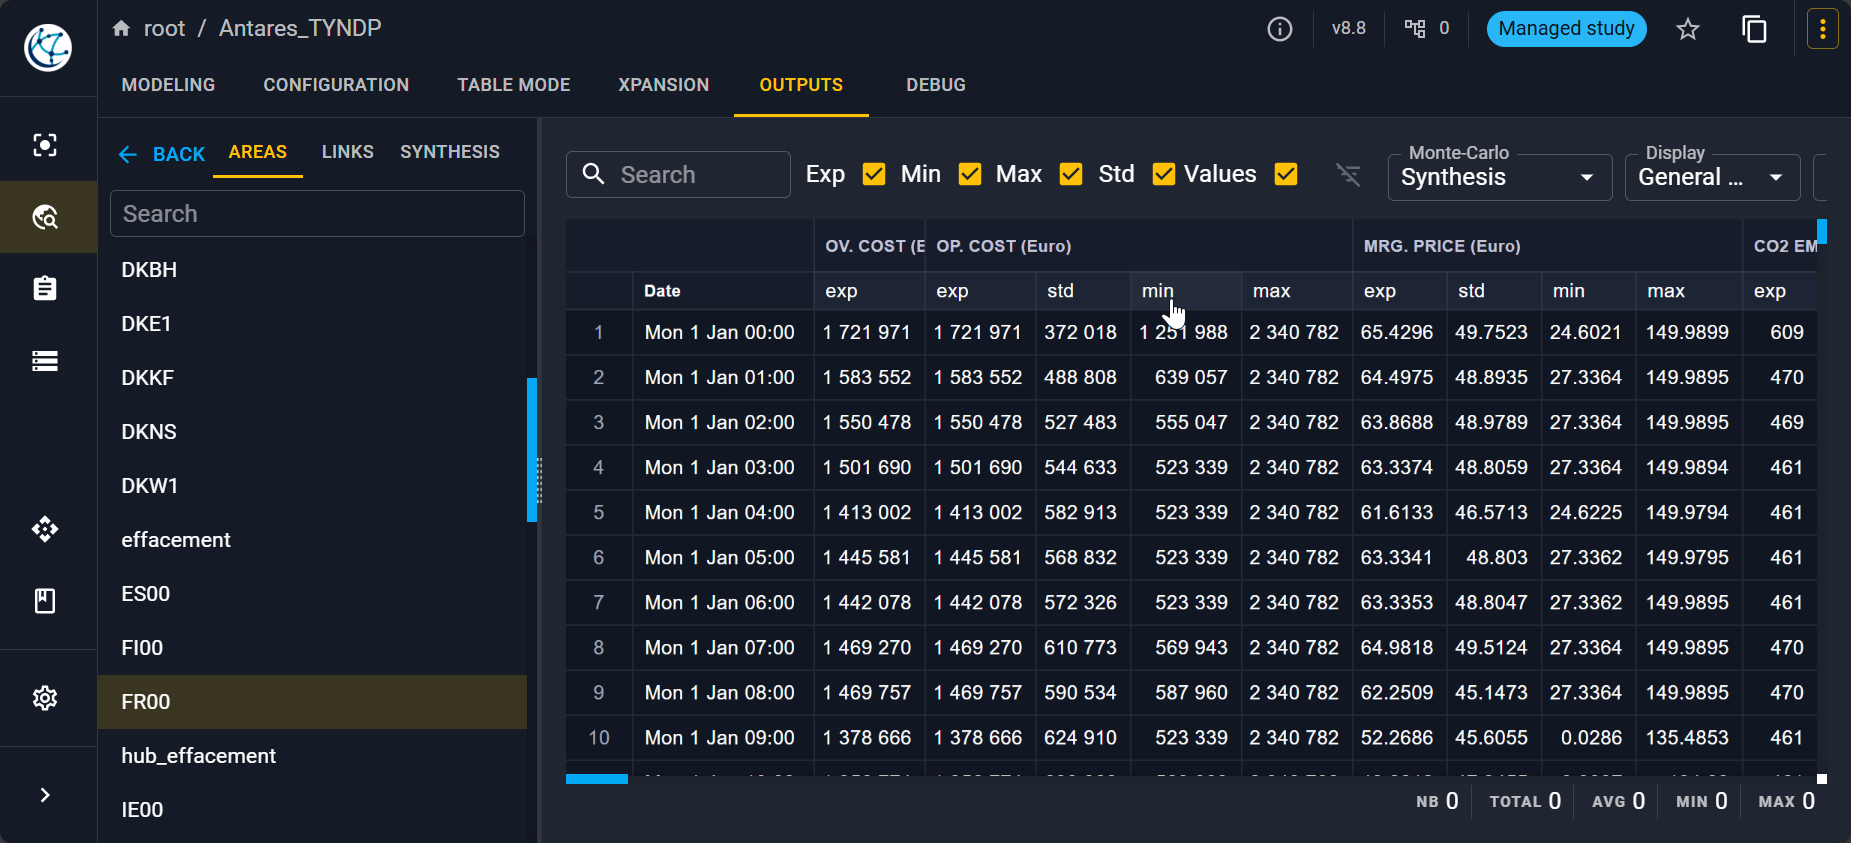
You can view results per area, per link and also have some synthesis.
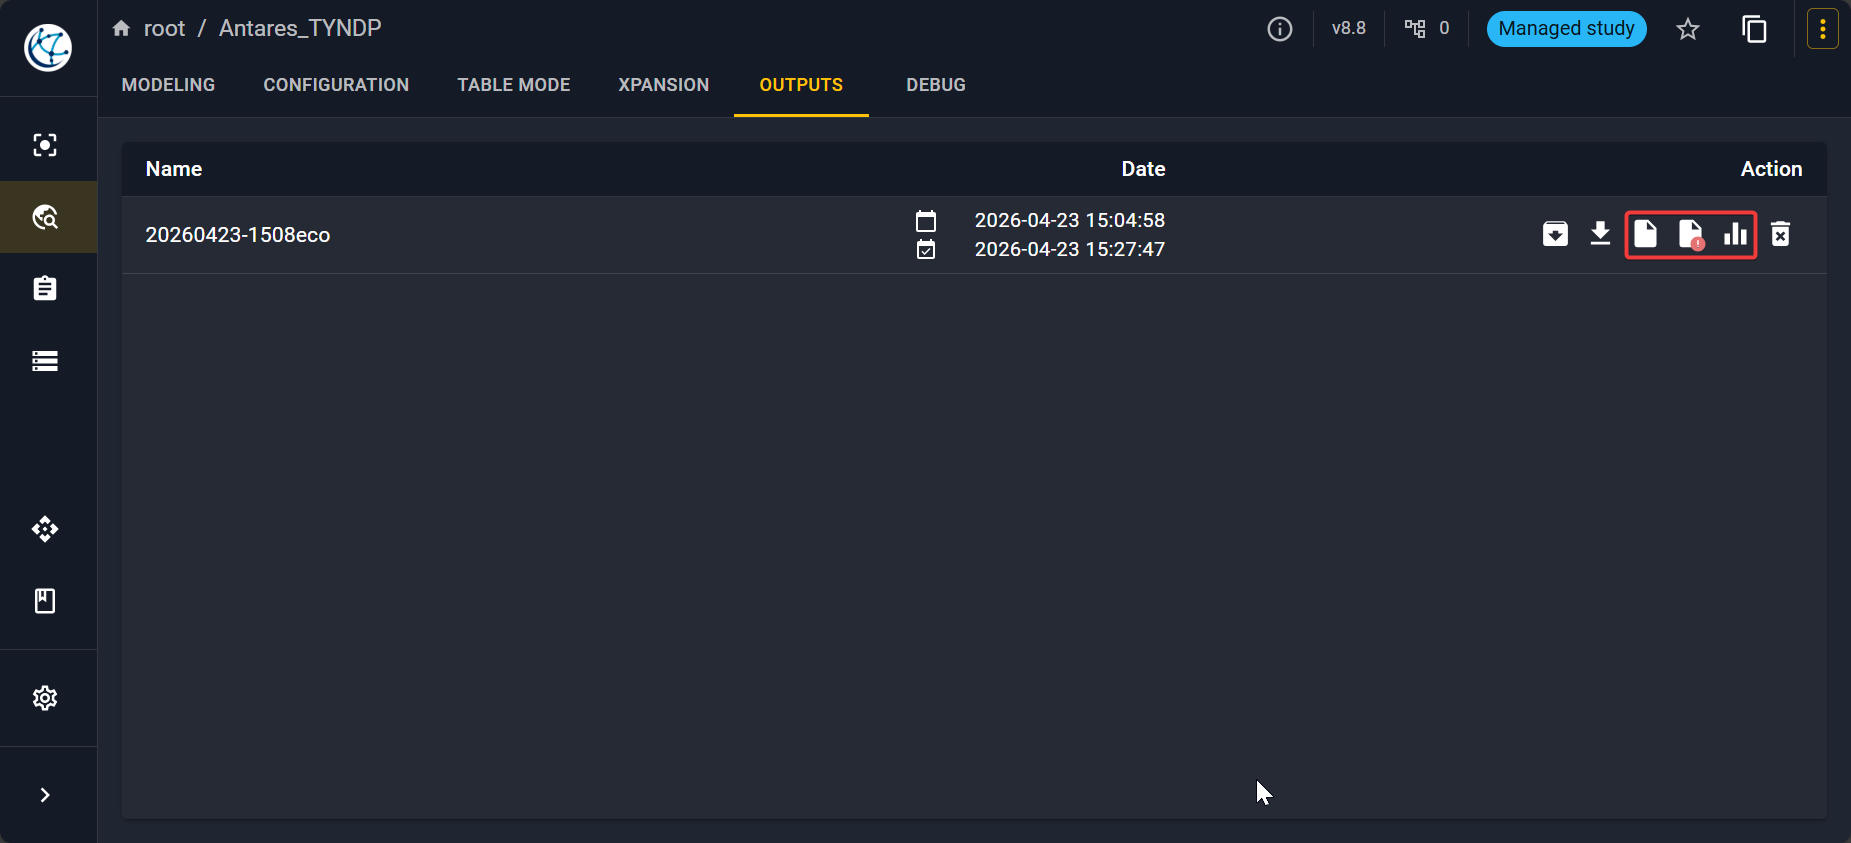
Other insights: logs, errors and digest
Sometimes it is interesting to view the logs and understand what went wrong during the simulation. You can click in the output list on the different icons highlighted below to get information about logs, errors and digest.
Other tabs: Table Mode, Xpansion, Debug
You can find more information on these tabs in the following pages: