Visualize Antares outputs
After running the simulation Antares offers you multiple way to display the relevant metrics at a given time step, for each year or aggregated.
Output selectors
Here is the default view when you open the Output tab:
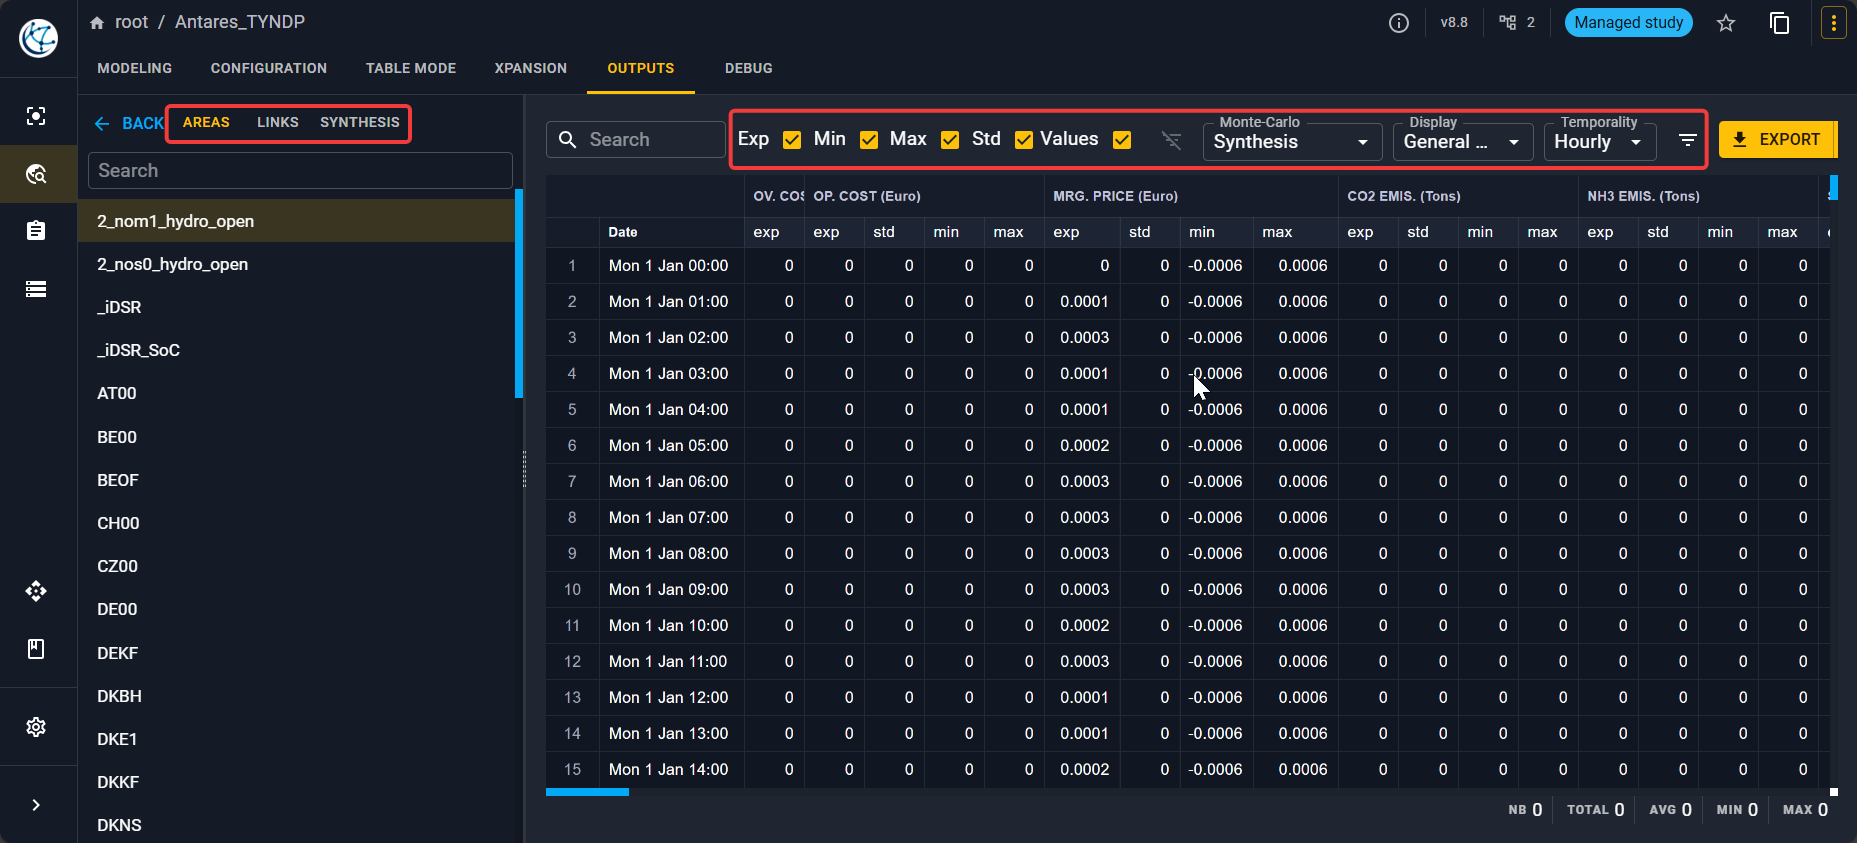
In the left panel, you have the possibilities to see outputs for:
- Areas
- Links
- Synthesis where you can find:
- a Digest where you can see a summary of the simulation.
- a Thermal synthesis with key indicators for each thermal cluster.
From the Monte-Carlo simulation, you have the possibility to see:
- The synthesis of all the simulated years with the average, min, max, variance or values for each variable.
- The output year by year where you can select the year index. Note that for a year to have an output, it should appear in the scenario playlist.
- A variable per variable view where you can select the variables you want to see.
For each view, you can select the Time step to visualize the variables.
Besides, you can select what you want to display:
- General values
- Thermal plants
- Renewable clusters
- Record years
- Short term storages