Table mode
The table mode is a way to visualize a synthesis of your input variables. It is especially useful to check the values of a specific parameter in each area of the study.
Table mode tab
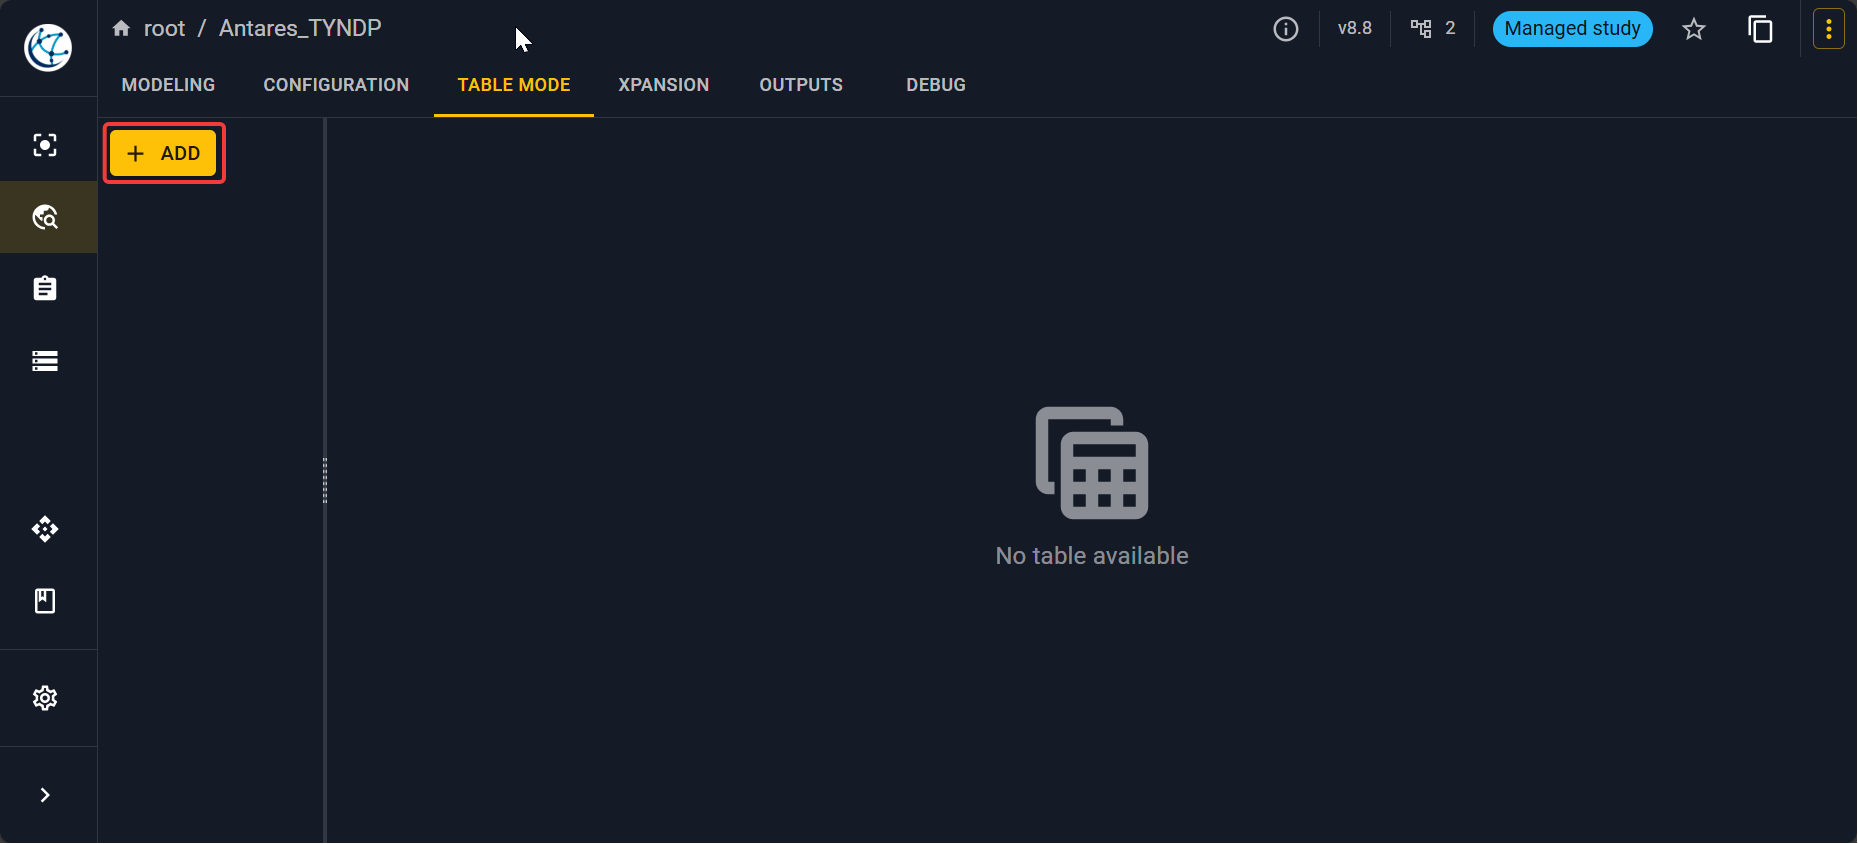
First, you have to go into the Table mode tab, you will have an empty tab.
Principle
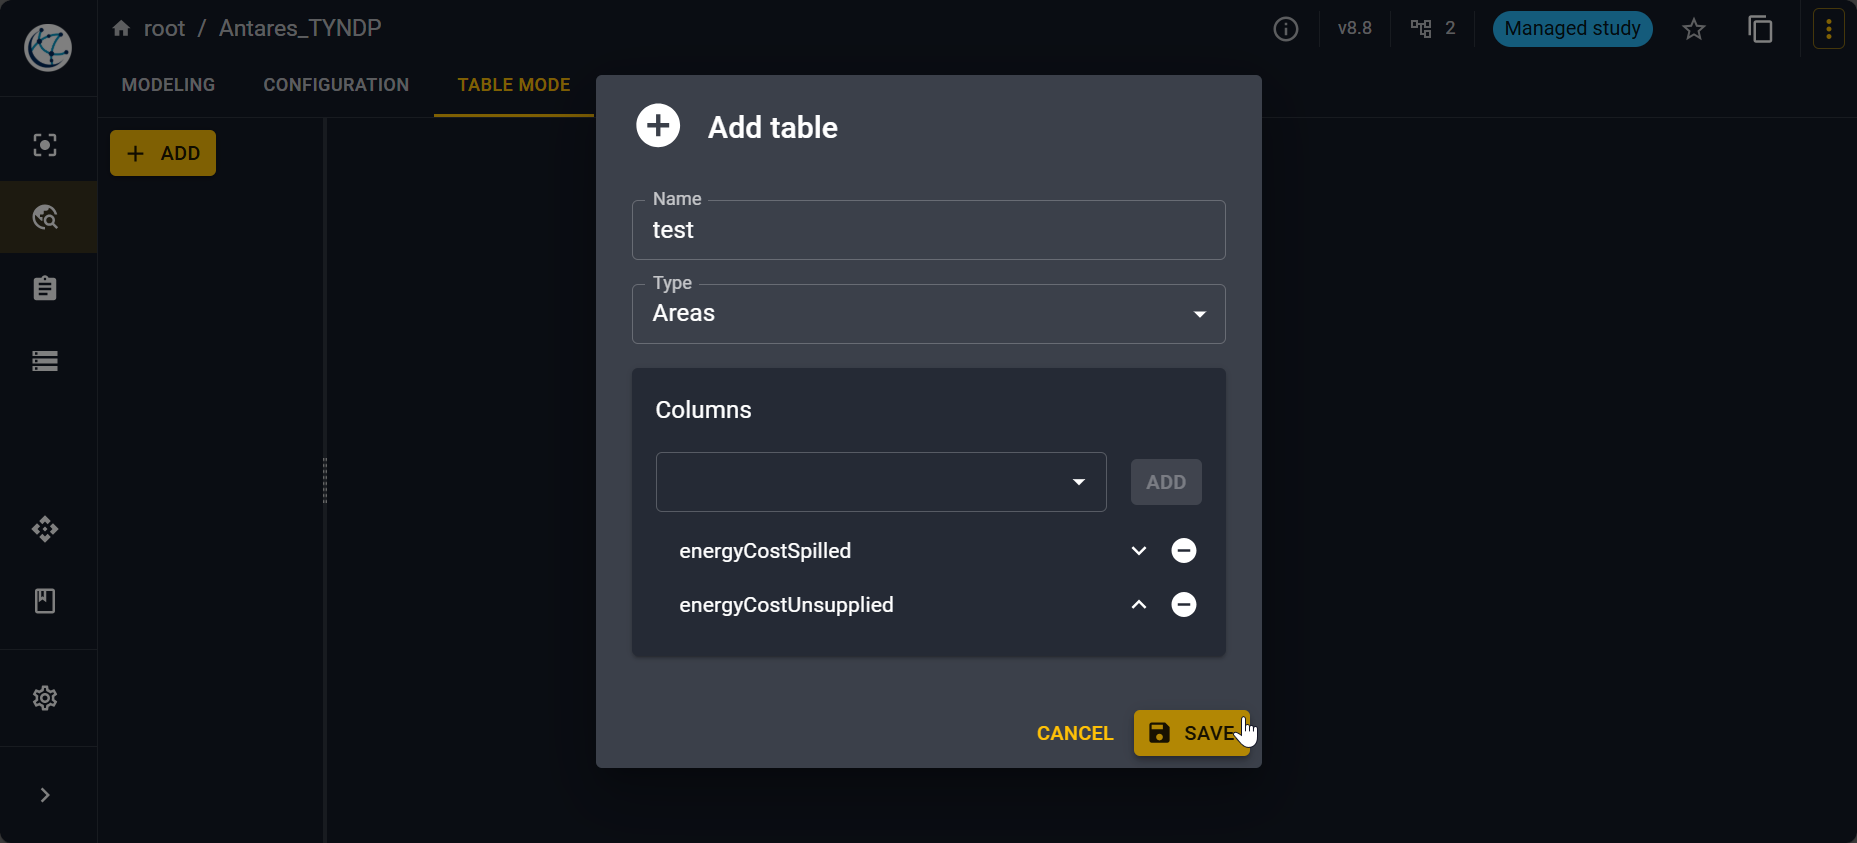
Click on Add to open a pop-up. You will need to name your new table, select an object type on which you want to make an aggregation of input variables. You have the possibilities:
- Areas
- Links
- Thermals
- Renewables
- Short-term storages
- Binding constraints
- Additional constraints on short-term storages
Then, select the columns you want to see that is to say the input variables you want to see for each object type. The list of available variables are displayed according the object type.
Simple example
For example, to see the spilled and unsupplied energy cost for each area:
You will then have the following view.
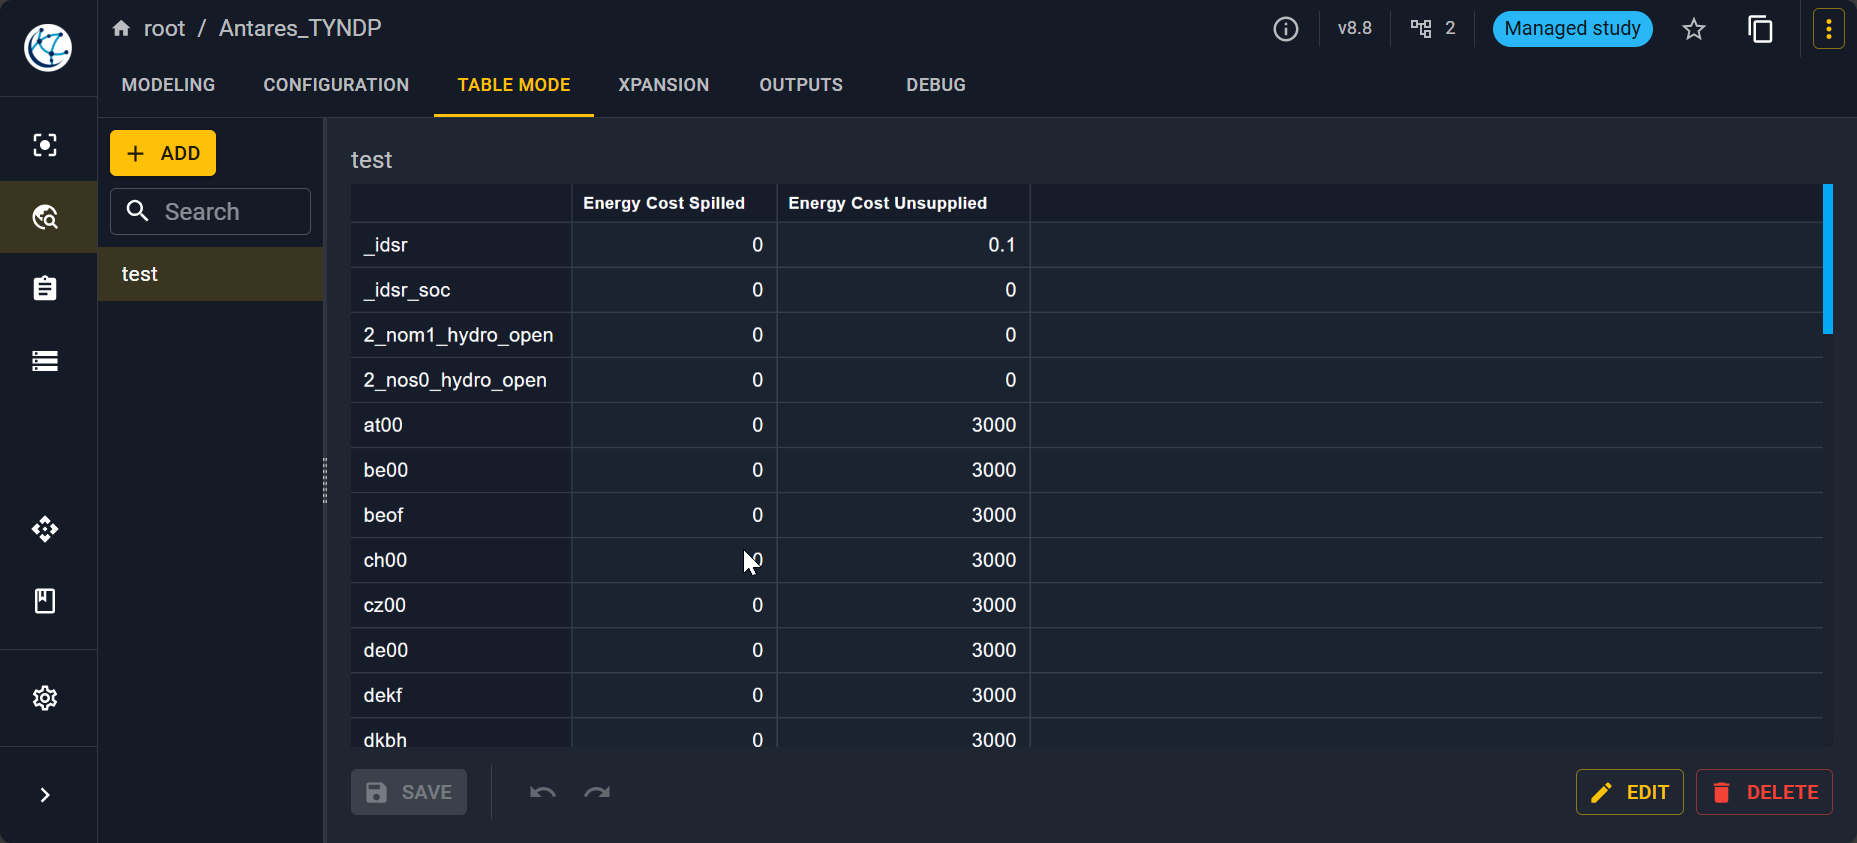
Note
You can edit the values here also if you see that something is wrong.